go to WEEK 4 Problem 1 2 3 4 5 Online Course Support
MSE 5090: Case Studies in Material Selection
Week 4 - Cambridge Material Selector1
Problem 1.3
The demand for electricity is greater during the day than in the small hours of the night, for obvious reasons. It is not economic for electricity companies to reduce output, so they seek instead to smooth demand by charging less for off-peak electricity. Cheap, off-peak electrons are exploited for home or office heating by using them to heat a large mass of thermal-storage material from which heat is later extracted when the cost of power is at its peak. Plotting compound properties: storage heaters
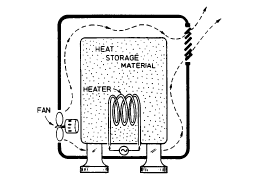
Figure 1.2 shows how a storage heater works. A resistor heats a thermal mass during off-peak hours. During the expensive peak-demand hours the power is switched off and the fan blows air over the hot mass, extracting heat and passing it to the room. To hold enough heat to he useful, the thermal mass has to be large, but it must also be cheap. The best material is that which stores the most thermal energy, CpDT (for a given temperature rise, DT) per unit cost Cm, where Cp is the specific heat in kJ/kg of the material, and Cm is its cost per kg. It must also be capable of withstanding indefinitely the temperature of the heater itself, which we take to be 330°C (600 K). What are the best materials for the thermal mass?
To maximize the heat stored per unit cost, we seek materials with high values of the index
Figure 1.2 A storage heater. The heat-storage medium is chosen to have the highest heat capacity per unit cost. which can also tolerate a temperature of at least 600 K. Tackle this problem in two ways. (a) Make a 2-stage selection.
Stage 1: specific heat, Cp (a thermal property) plotted against cost, Cm (a general property); a selection line of slope 1 picks-off materials with large values of Cp/Cm.Stage 2: maximum service temperature, Tmax (a thermal property) plotted against material class (identifiers), selecting ceramics, metals and polymers; a selection box with its bottom edge at 600 K gives materials with Tmax bigger than this.
Final optimization: turn on the So Far button on both charts; pick up the line on the Stage 1 chart and squeeze it to higher values of Cp, optimizing the selection.
(b) Do the whole thing with one stage.
The stage: create a chart with maximum service temperature Tmax on the X-axis and the compound property Cp/Cm on the Y-axis. Make this by selecting both Cp and Cm and changing the power on Cm to -1. Use a box selection to choose materials with Tmax > 600K and the largest values of Cp/Cm. You should end up with the same selection as before.
1. Ashby, M. and D. Cebon, Exercises in the Use of CMS 2.0, Granta Design, Cambridge UK, 1995, 7-8. 

Last update 9-20-98